Fernando Oviedo
Projekte
13. Februar 2025incendios-en-argentina.netlify.app

Visualizing Wildfires: A Satellite Data Project

How I transformed my concern for wildfires in Argentina into a web application that makes satellite data accessible to everyone.
Visualizing Wildfires: A Satellite Data Project
Live-Ansicht
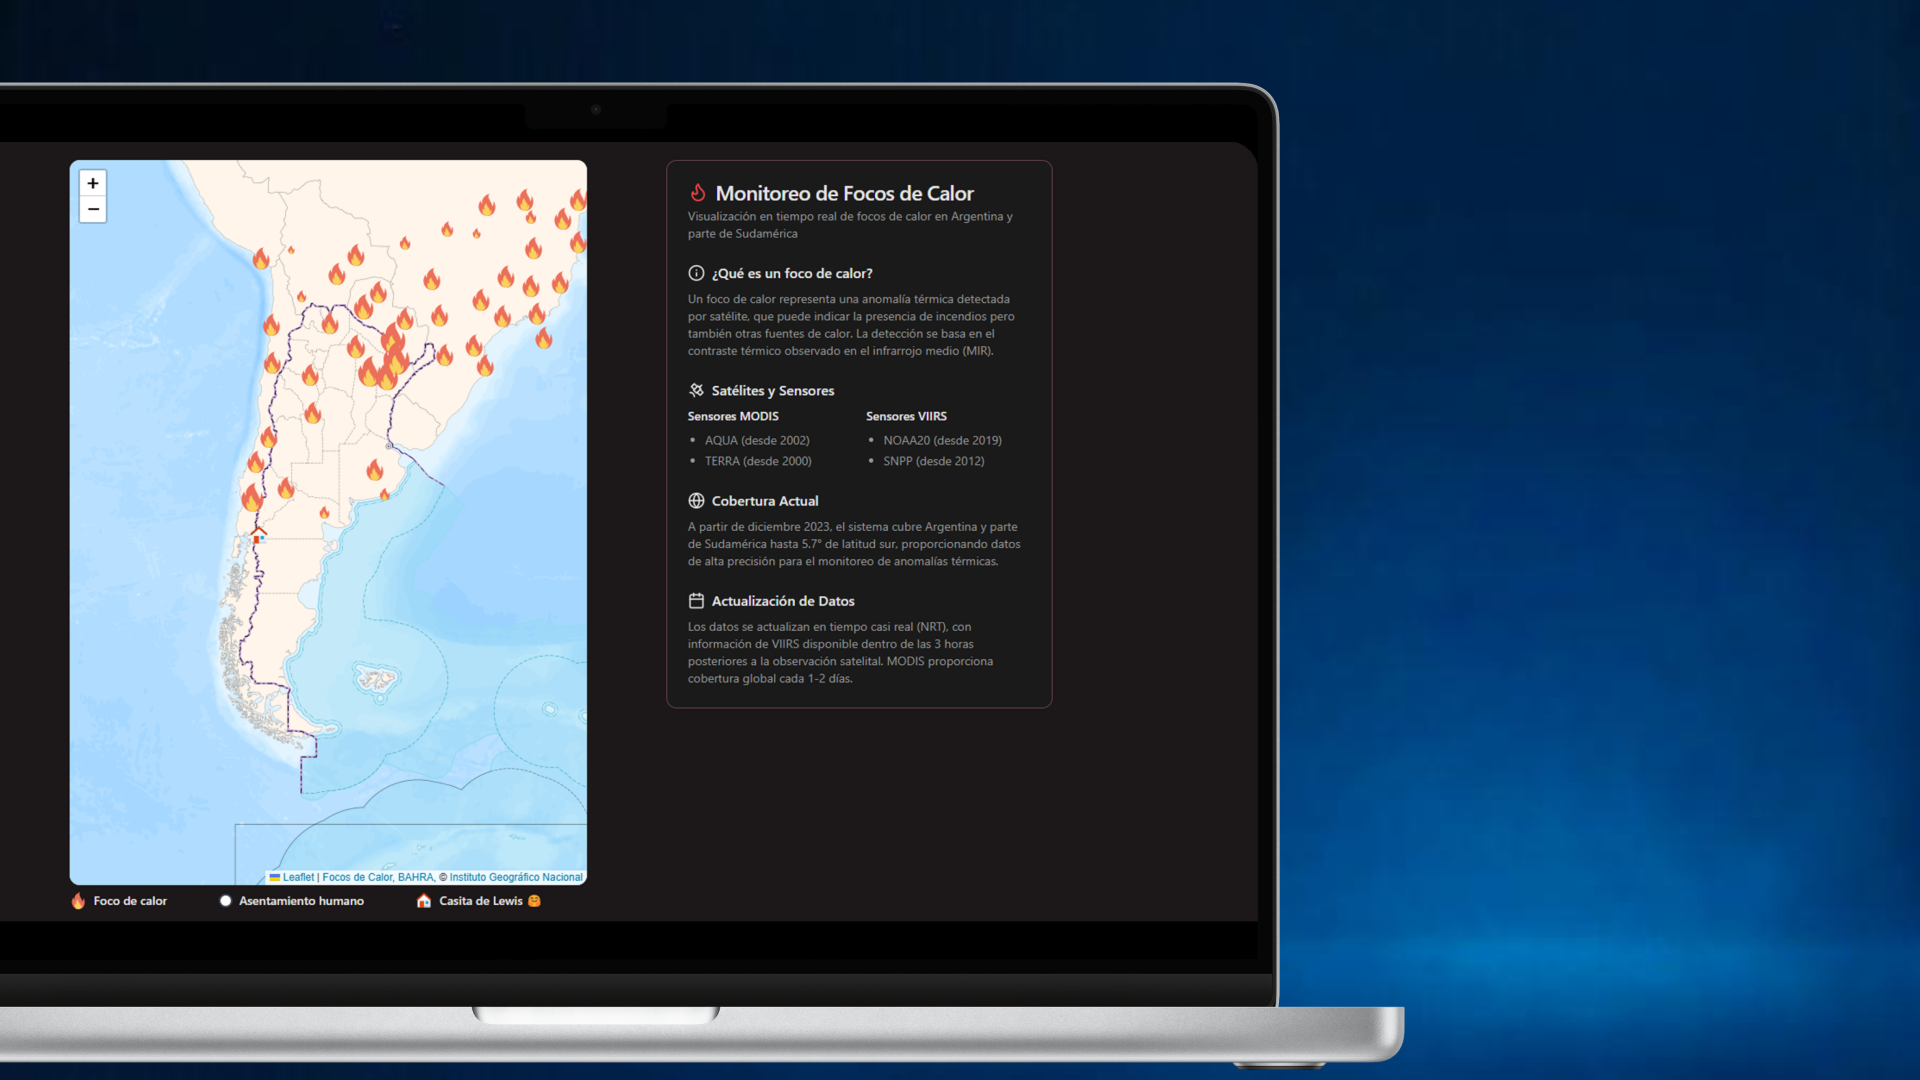
In early 2025, news began to spread about wildfires and hotspots in southern Argentina. At first, information arrived indirectly through videos, images, and messages from people in affected areas. Major media outlets gradually picked up these stories, but information remained scarce and fragmented. Driven by my passion for mountains and nature, I decided to search for more information online. The deeper I looked, the more I realized that available data was limited and poorly updated. I wondered: is there any resource that shows on a map which areas are affected, which hotspots remain active, or which areas have already been reduced to ashes? Assuming this satellite information existed, I imagined some entity would have already created an accessible visualization. To my surprise, this wasn't the case-at least not in a simple and direct way. Services like NASA's FIRMS or the CONAE hotspot catalog existed, but most were buried in government portals with unfriendly interfaces or required specific technical knowledge to interpret. That's when my project was born: how could I build an interactive map to visualize hotspots in Argentina in real-time, in a simple and intuitive way? Here is the live application
I began by exploring FIRMS, analyzing how their platform worked. Although I had previously worked with maps, I had always consumed data from external APIs designed specifically for mapping. With FIRMS, I discovered they offer WFS (Web Feature Service) and WMS (Web Map Service) with open data extracted and processed from NASA's MODIS and VIIRS sensors. Since the data is global, I conducted an initial test by limiting the area to Patagonia, Argentina, and positioning GeoJSON elements on a custom map using react-leaflet. Evaluating the result, I noticed that the data wasn't very complete and only provided confidence level (useful for determining whether a hotspot is actually an active fire and not, for example, an area with volcanic activity). When visualizing the map with markers, I detected that it wasn't possible to differentiate between hotspots of different magnitudes or intensities. At this point, I had:
  1. A functioning basic map
  2. The logic for positioning markers
All that remained was improving the data source. Diving deeper into my research, I discovered that Argentina's CONAE (National Space Activities Commission) processes and distributes similar information for South America, extracted from the same sensors and satellites. The crucial difference is that their data includes much more valuable information:
  • Pixel brightness temperature (FP_T21/FP_T31 for MODIS, FP_TI4/FP_TI5 for VIIRS)
  • Radiative power (FP_Power in MW)
  • Detection confidence level (FP_Confidence)
  • Precise pixel dimensions (SCAN/TRACK)
  • Political divisions (province/department)
However, accessing this data presented significant challenges:
  1. Fragmented documentation: Technical information was scattered across multiple PDF documents and web pages.
  2. Unintuitive interfaces: The official web application required multiple steps to perform basic queries.
  3. Mandatory registration: Registration was required to download any data.
  4. Limited visualization: Visualization tools were basic and not very interactive.
Despite these obstacles, I discovered that CONAE exposes this data through geospatial web services (WFS), which simplified my work to just changing the service I initially consumed.
To implement my idea, I decided to create a rapid prototype with technologies I knew well:
  • Vite + React: For quick development and deployment
  • React-Leaflet: A library that facilitates the integration of interactive maps in React applications
  • ArgenMap: As a base tile provider, offering detailed maps of Argentina
  • GeoJSON: To process vector data of hotspots obtained from CONAE's WFS service
The development process followed these steps:
  1. Obtaining hotspot data: After my initial experience, I decided that in the near future I would develop my own data extraction and processing. To prepare for this scalability, I designed a class that manages data retrieval in a modular way:
The new information about hotspots allowed me to dimension the markers according to pixel size and radiative power (FP_Power), achieving a much more informative visual representation.
  1. Integration with WMS for geographic context: I added a WMS layer that shows human settlements and populated centers, allowing quick visualization of which communities might be at risk:
During development, I faced several technical challenges that required creative solutions:
The WFS service could return thousands of points for extended periods, negatively impacting browser performance and user experience. Solution: I implemented a clustering strategy that groups nearby hotspots when the map zoom is distant, dramatically improving performance without losing critical information.
This solution not only improved performance but also provided a clearer visualization of hotspot concentrations.
CONAE's WFS service has limitations regarding the number of features it can return in a single query, making it difficult to obtain historical data or data for extensive areas. Solution: I developed a system of paginated and parallel queries that request data in smaller batches and then combine them on the client side, allowing visualization of more extended periods without exceeding service limits.
This project, born from a personal concern, has evolved rapidly. To enhance its impact, my next steps include:
  1. Integration of burned area data: CONAE offers monthly burned area products derived from MODIS data that will allow analysis of post-fire impact and the evolution of affected areas over time.
  2. Customized alert system: Allow users to define areas of interest (such as properties, nature reserves, or communities) and receive notifications when new hotspots are detected in those areas.
  3. Migration to NextJS: To improve scalability, I plan to migrate the project to NextJS, leveraging its caching capabilities and server-side rendering (SSR) to optimize data processing and delivery.
  4. Mobile optimization: Improve the experience on smartphones and tablets, crucial for field users such as firefighters, park rangers, or rural producers.
  5. Predictive models: Integrate meteorological data and propagation models to estimate the risk and possible expansion of active fires, transforming the tool from informative to preventive.
This project demonstrates the power of democratizing scientific data through intuitive interfaces. Satellite information about fires already existed but remained effectively "hidden" behind complex interfaces and cumbersome processes, inaccessible to those who need it most. Visit the live application to explore the final result. The most sophisticated technology loses relevance if it's not accessible to its potential beneficiaries. My goal with this application is to build bridges between scientific institutions and communities, especially in situations where timely access to information can make the difference between prevention and tragedy.